Nov 3 Update
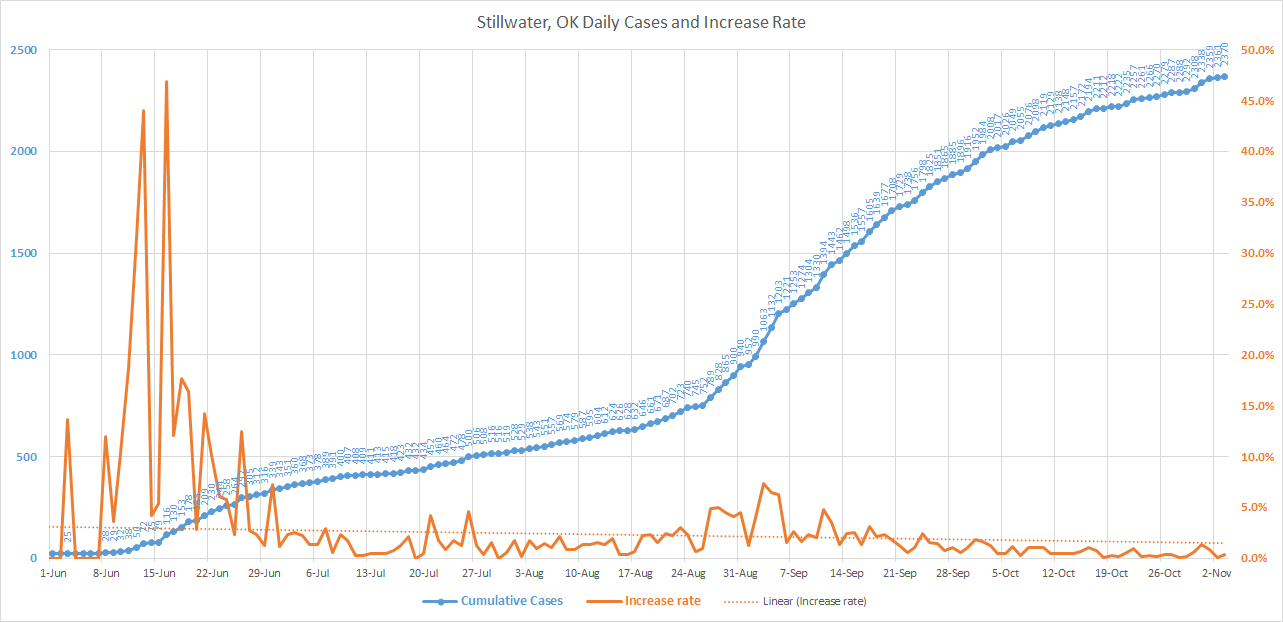
Stillwater:
Total Cumulative Confirmed Positive Cases: 2,370, 9 new case, 0.4%↑.
Deaths: 8
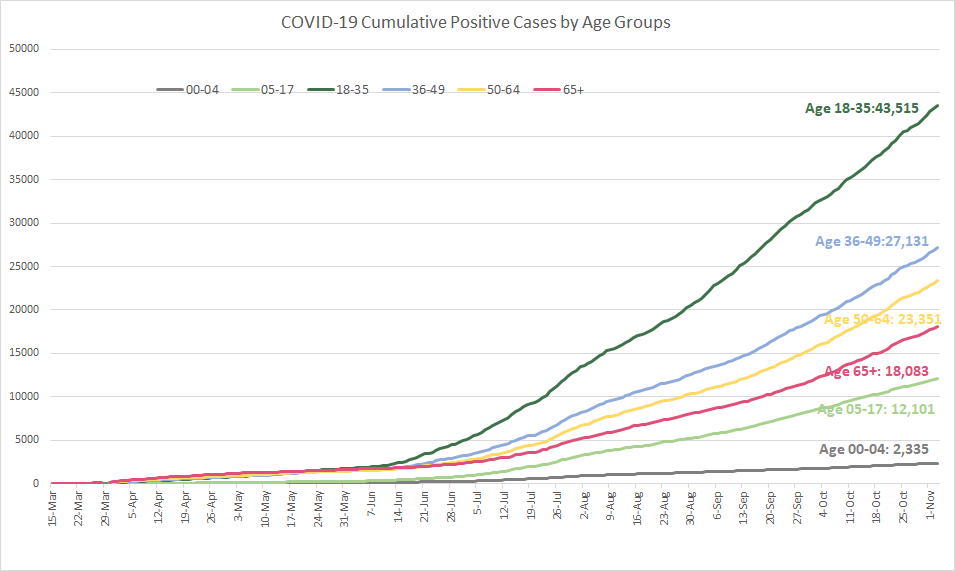
Oklahoma:
Total Cumulative Confirmed Positive Cases: 126,526, new cases: 1,331, 1.1%↑
Total Death:1375, 21 new cases, 1.6%↑.
First pediatric death is reported on Jul 13th.
*Not all cases are submitted during weekends. No death report for weekend.
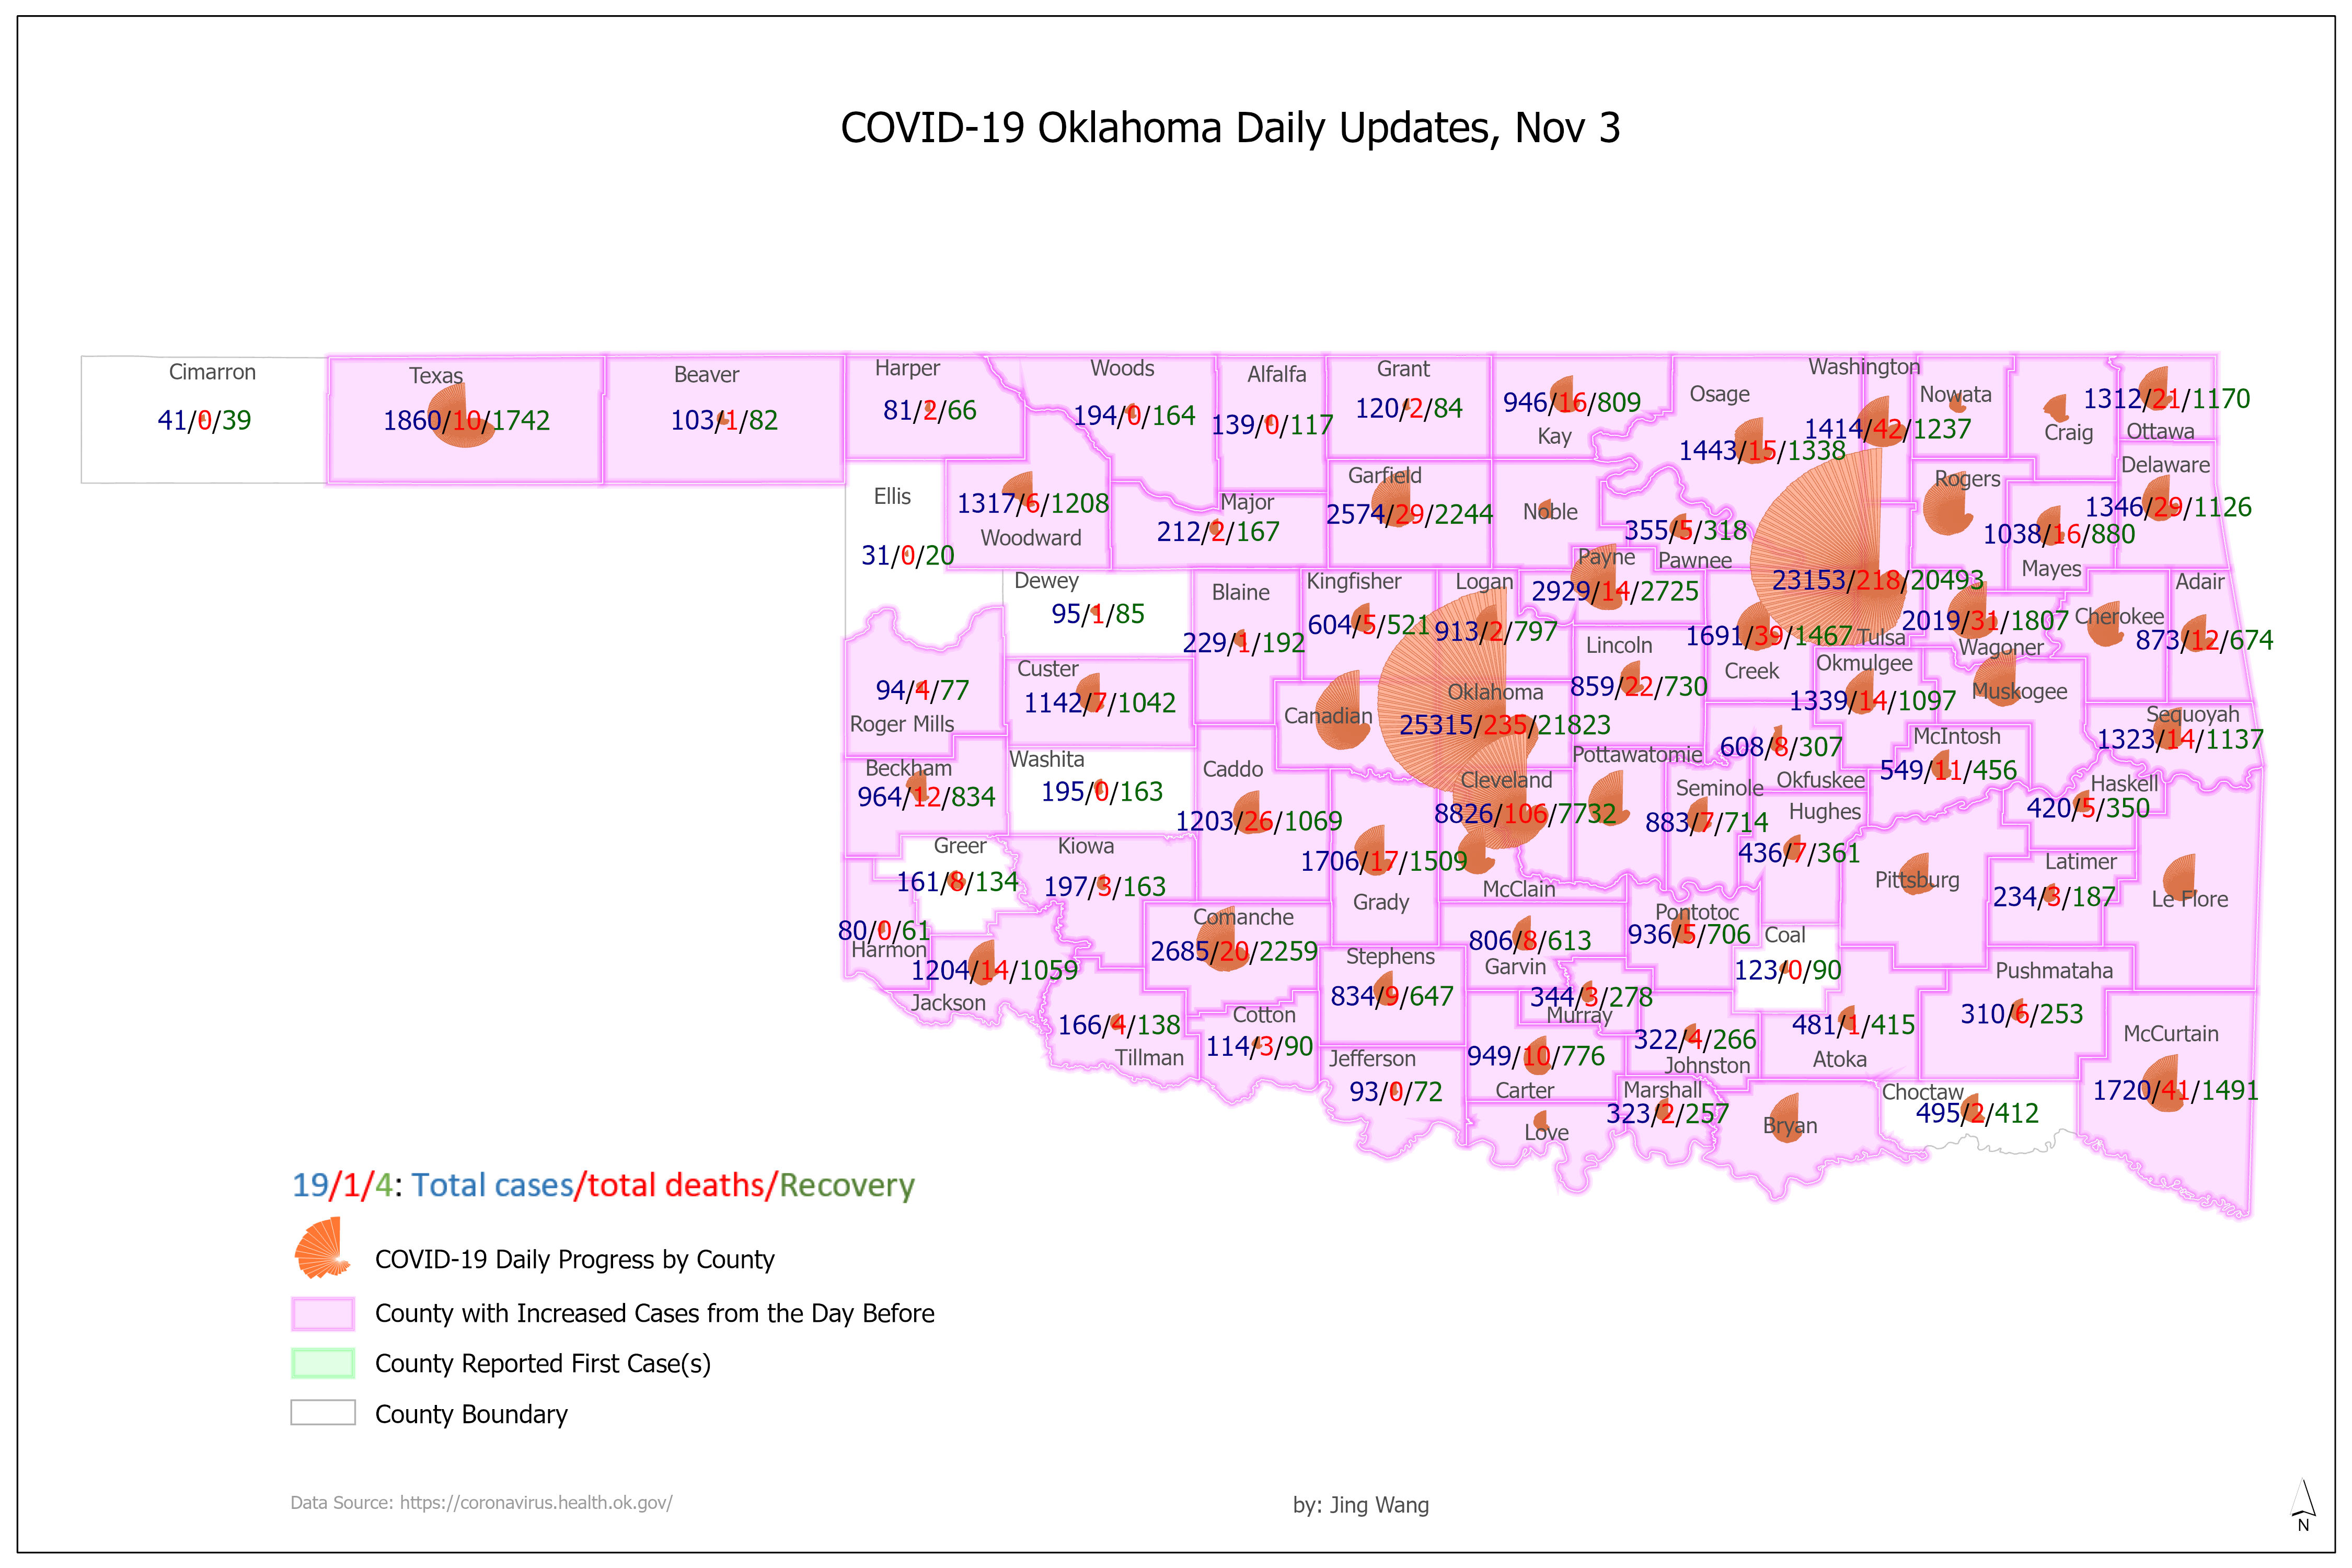
About the map:
Numbers in blue shows total cumulative confirmed postive cases for each county as of today
Numbers in red shows the number of deaths for each county as of today
Numbers in green shows the number of recovered* for for each county as of today
**Recovered = Currently not hospitalized or deceased and 14 days after onset/report
The piecharts in the center of each county show the daily progress of confirmed COVID-19 cases since Mar 6, each segment of the piechart represents one day. The radius of the segment (scaled) shows the magnitude of the number
Click the Map for enlarged size
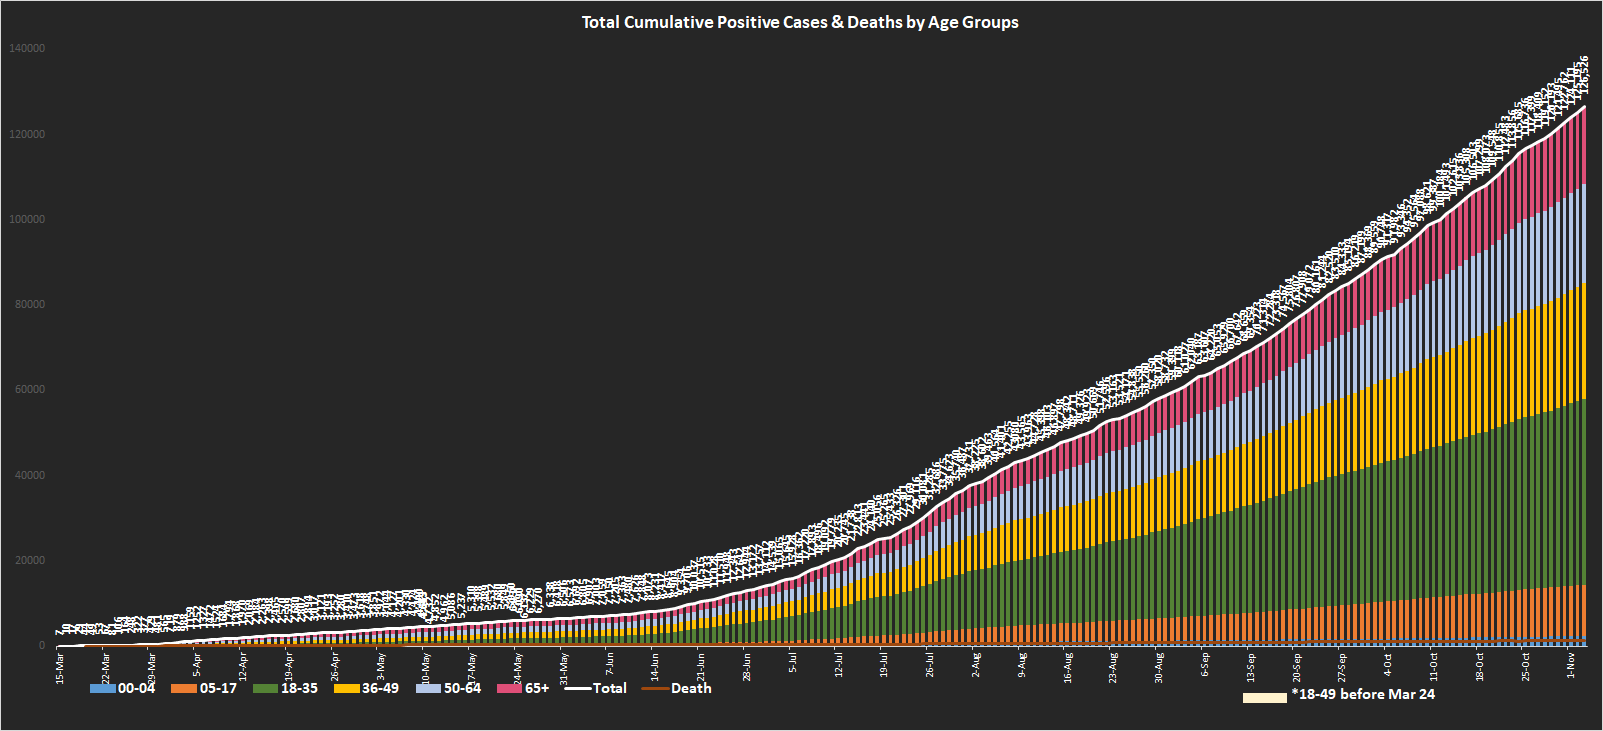
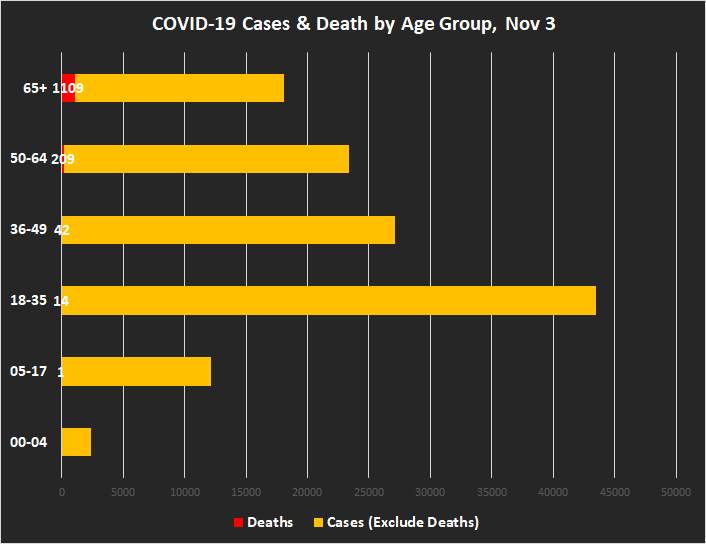
*The data released Mar 29 do not have age group break downs hence a lack of the column
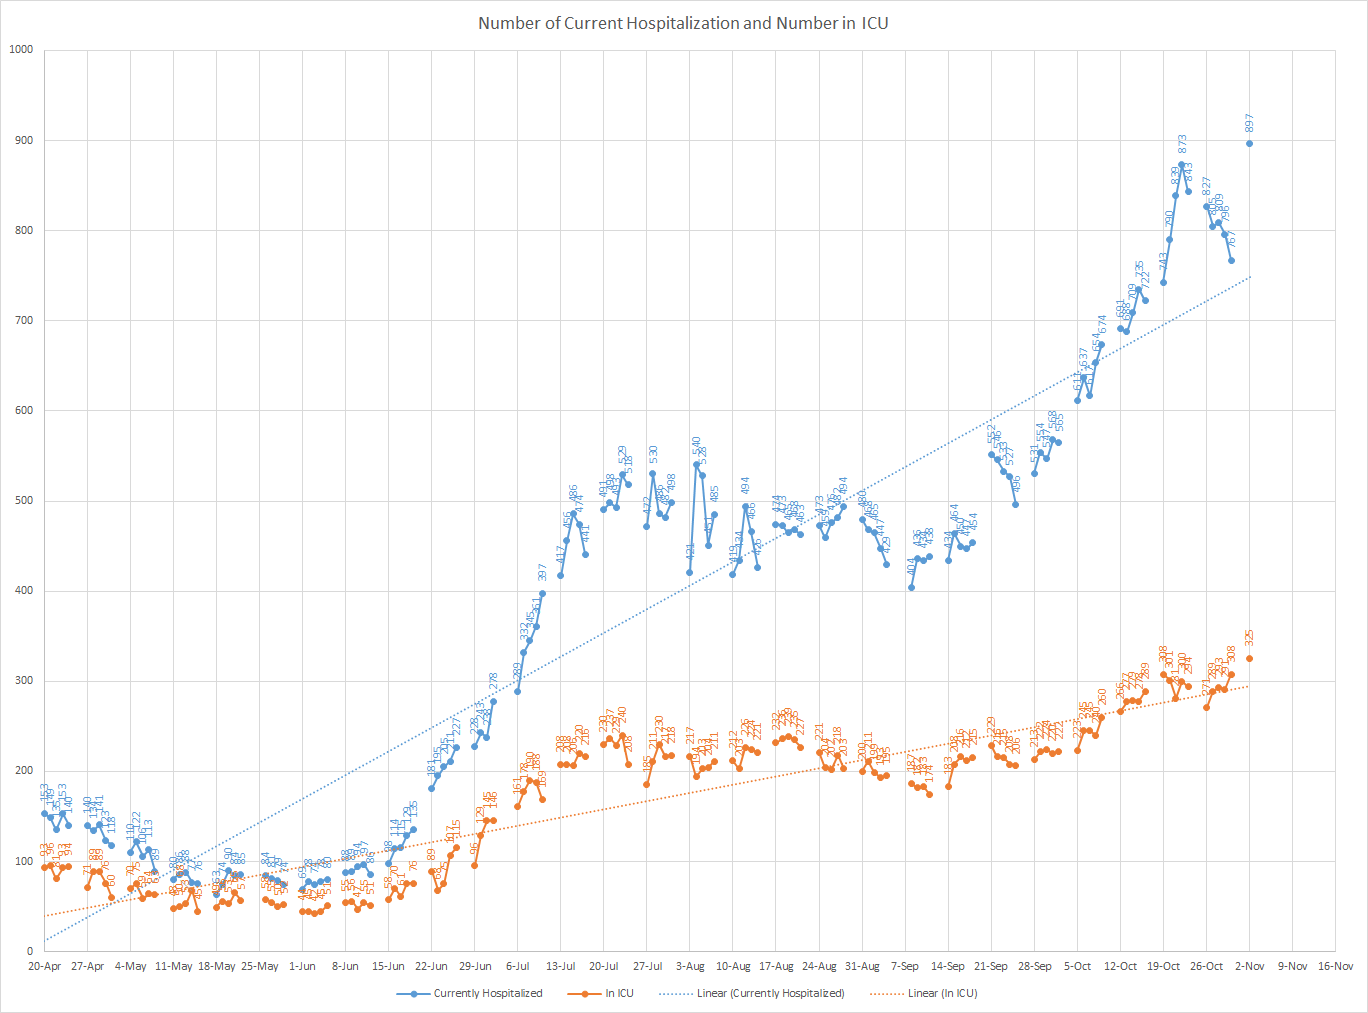
Hospitalization
City Maps by region (Last Update Oct 30)
Note: With the State’s Catastrophic Emergency Declaration expired by the end of May, Oklahoma State Department of Health (OSDH) initially decided the agency would no longer update data by city and zip code. (See Article Here)
The decision was then revoked on June 3 (See Article)
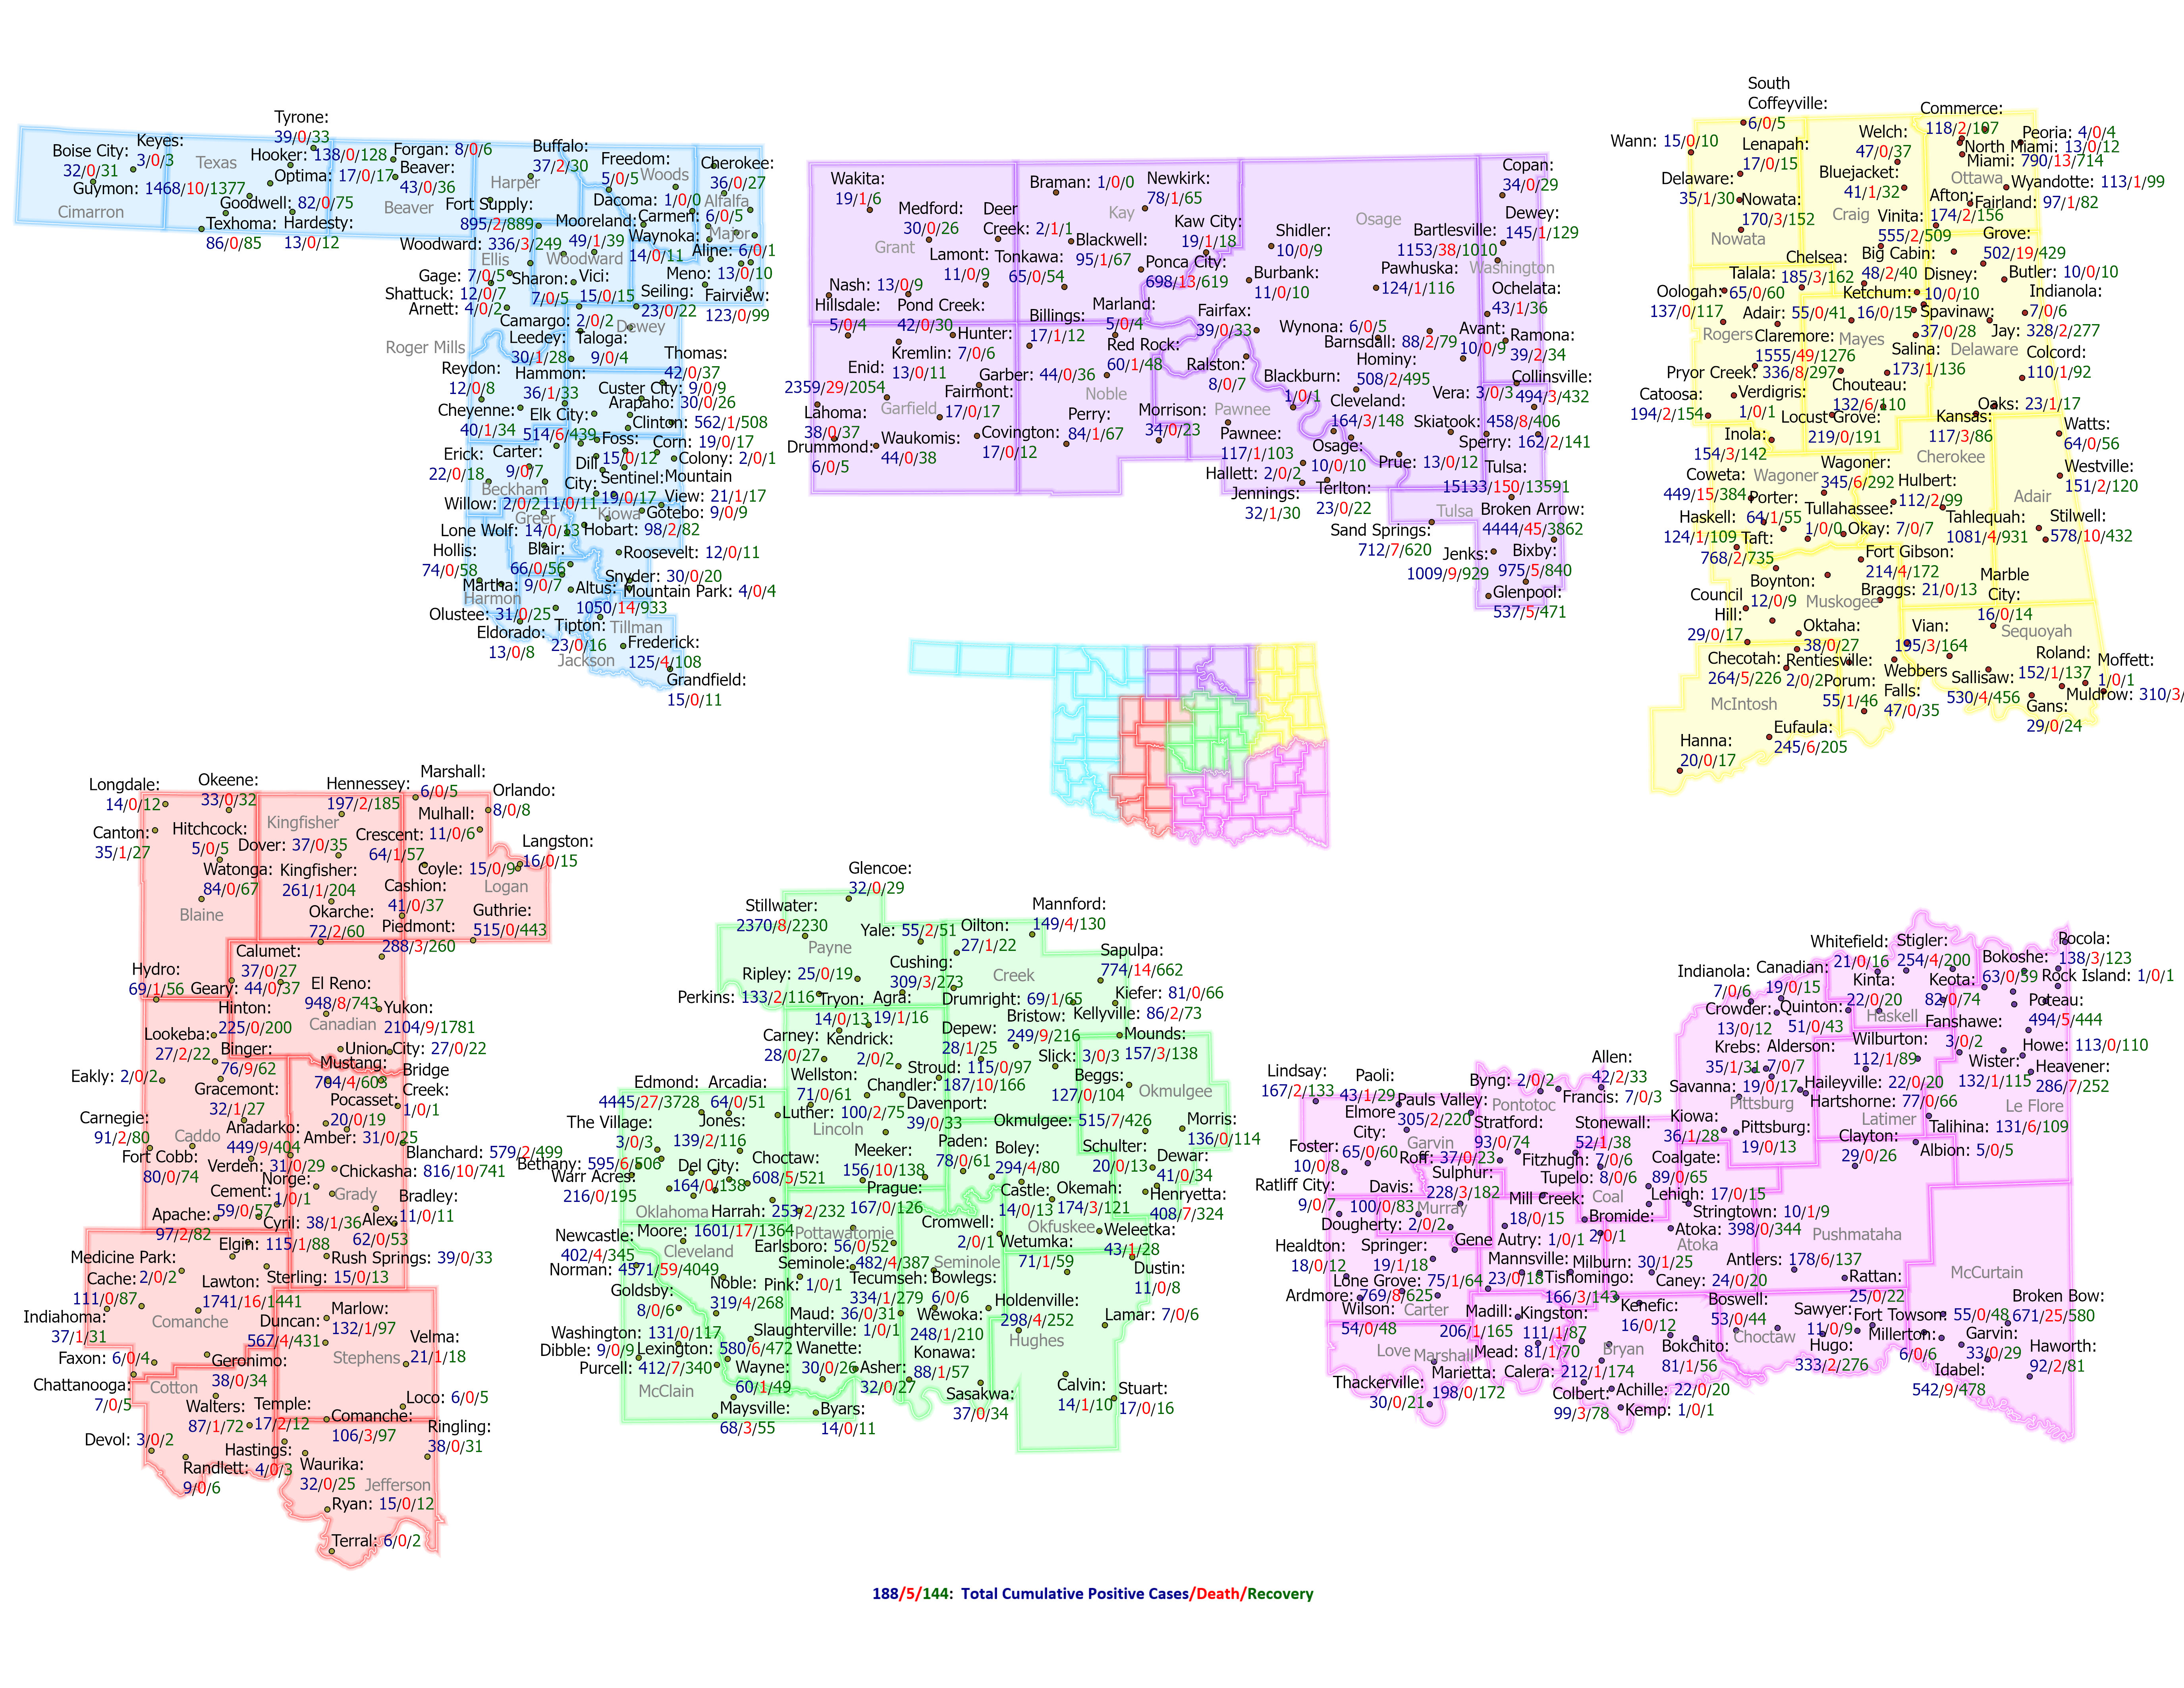
Click map to view a enlarged map
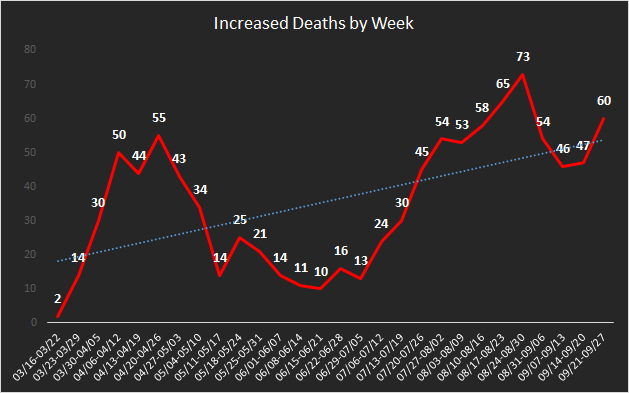
Weekly Report:
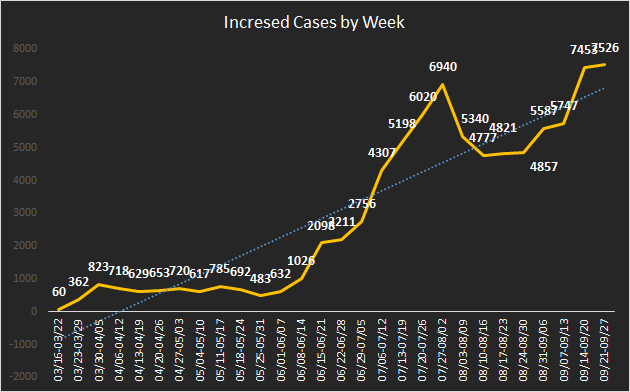
Figure 1. Number of increased positive cases every week in the state of Oklahoma with trendline.
On Mar 24, the Governor's Order were announced to close all non-essential businesses. The next week (Mar30-Apr5), the increase rate started to dropp for the first time.
After the announcement, Oklahoma had two weeks of slower increase of COVID-19, which is used as the evidence of the Apr 22’s announcement to reopen some nonessential businesses starting on Apr 24. The same week experienced a rebound of increase. The week after experienced a greater weekly increase. During the second week of May, the growth rate begin to slow down and reached a point lower than previous three weeks.
For most part of May, the increase began to slow down until the beginning of June when the positive cases started to surge. Each week witnessed a new record since then. During the second week of July, the weekly increase (4307) almost doubles the previous week(2756).The weekly increase rate continue to rise until the beginning of August. After two weeks of slowered increase, the trendline begin to climb upward.
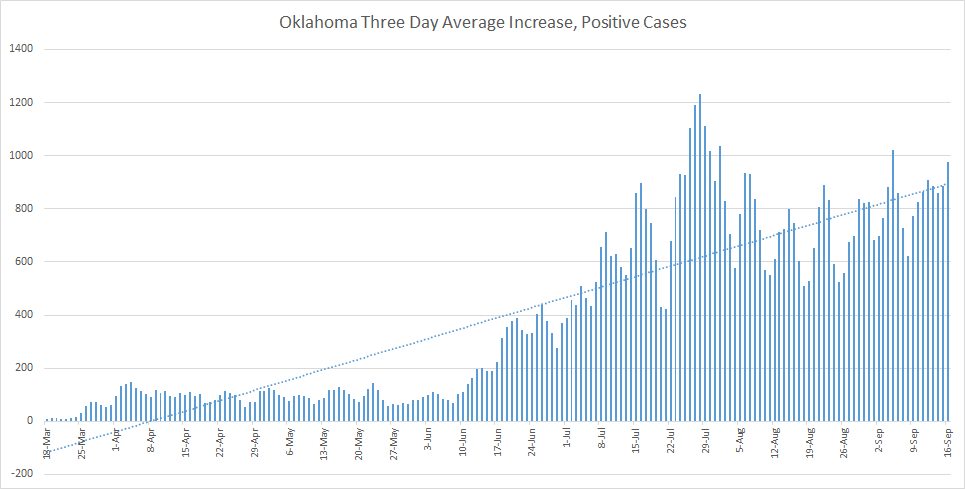
Three Day Average for New Cases:
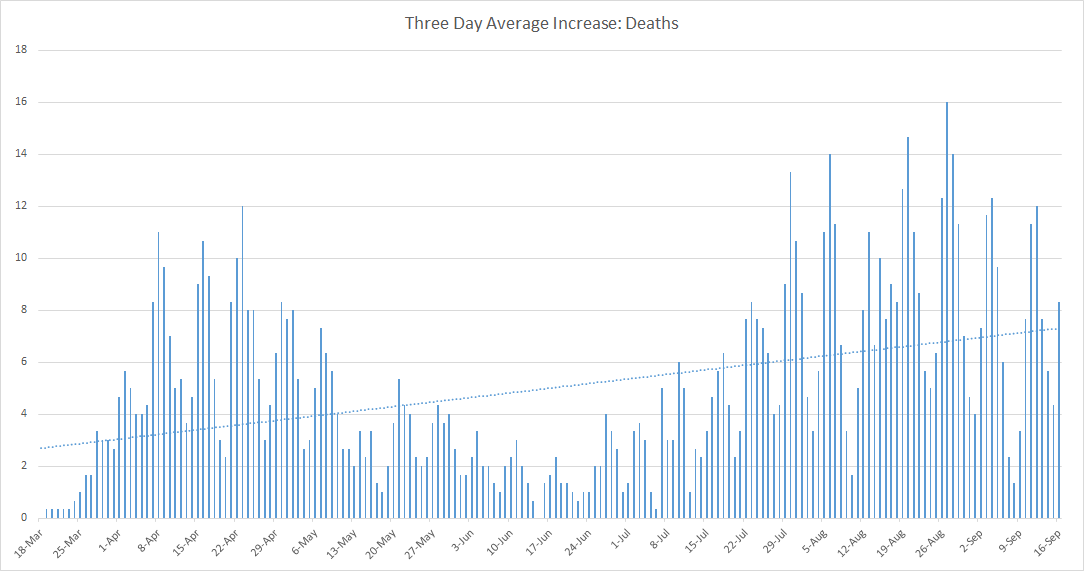
Three Day Average for Increase of Deaths:
Please contact remote.sensing@okstate.edu for questions
